Data Analytics Masters Program

Categories
Data Science
Read Review
5.0 (7575 satisfied learners)

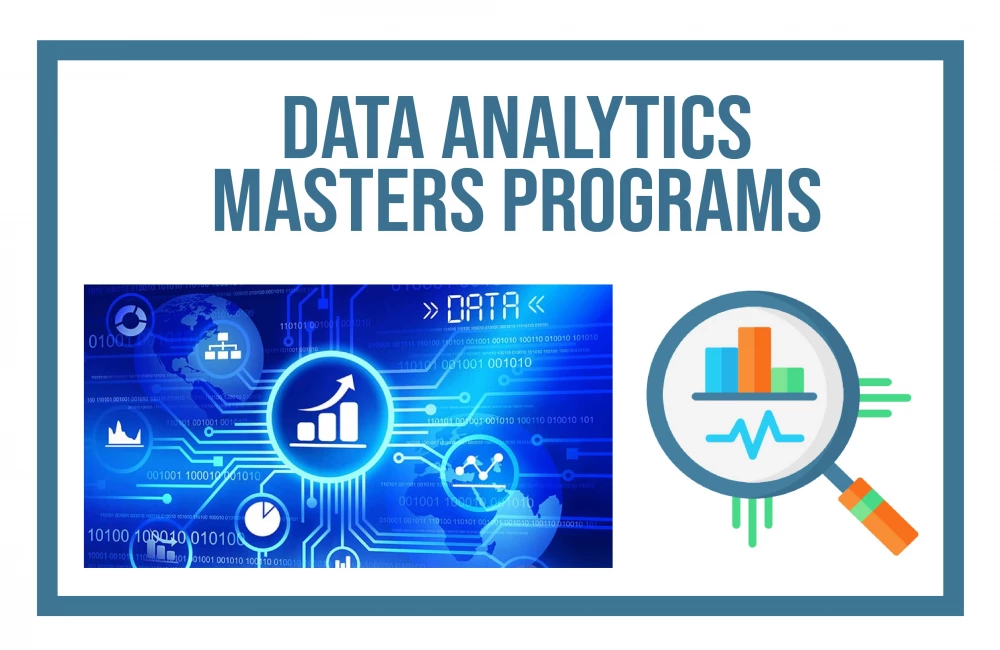
Enroll now to become a Certified Data Analytics expert with EDTIA Data Analytics Masters Program and upgrade your skills.

Course Description

Data Analyst Course makes you experienced in tools and systems utilized by Data Analytics Professionals. It contains in-depth training in Statistics, Data Analytics with R and Tableau.

Data analytics certifications are prepared to demonstrate you know data management and analytics concepts and are proficient in data analysis skills. On the other hand, data analytics certificates and certificate programs are created to help you know more about the field.

A data science master's program helps you acquire skills to collect, manage and interpret data, its types, trends, and deliver the results accordingly. This developed skillset is extended out throughout the M.

There are no prerequisites for enrollment in the Data Analytics Course Masters Program.

experienced professional working in the IT industry, a candidate preparing to enter the world of Data Analyst

Data analysts work with enormous volumes of data, turning them into insights businesses can leverage to create better decisions. They work across various industries—from healthcare and finance to retail and technology.

Data analytics assists individuals and organizations make sense of data. Data analysts generally examine raw data for insights and trends. They utilize different tools and techniques to help organizations make decisions and succeed.

Skilled data analysts are some of the most sought-after experts in the world. Because the demand is so intense and the supply of people who can do this job well is restricted, data analysts control huge pay and excellent perks, even at the entry-level.

Data analytics is the science of examining basic data to make conclusions about that Information. The methods and procedures of data analytics have been automated into mechanical methods and algorithms that work over raw Data for human consumption. Data analytics assist a business in optimizing its performance.

What you'll learn

  • In this course, you will learn: Statistics, Data Analytics with R Tableau and more

Requirements

  • There are requirements for learning this course.

Curriculam

Understand various data types, Various variable types, List the uses of varying types, Explain Population and Sample, Discuss sampling techniques, Understand Data representation

Introduction to Data Types
Numerical parameters to represent data a. Mean b. Mode c. Median d. Sensitivity e. Information Gain f. Entropy
Statistical parameters to represent data

Understand rules of probability, dependent and independent events, Implement conditional, marginal, and joint probability using Bayes Theorem, Discuss probability distribution, Explain Central Limit Theorem.

Uses of probability,
Need of probability,
Bayesian Inference,
Density Concepts,
Normal Distribution Curve

Understand the concept of point estimation using confidence margin, Draw meaningful inferences using a margin of error, Explore hypothesis testing and its different levels

Point Estimation,
Confidence Margin,
Hypothesis Testing,
Levels of Hypothesis Testing

Understand the concept of association and dependence, Explain causation and correlation, Learn the idea of covariance, Discuss Simpson's paradox, Illustrate Clustering Techniques

Association and Dependence,
Causation and Correlation,
Covariance,
Simpson's Paradox,
Clustering Techniques

Understand Parametric and Non-parametric Testing, various types of parametric testing, Discuss experimental designing, Explain a/b testing

Parametric Test,
Parametric Test Types,
Non- Parametric Test,
Experimental Designing,
A/B testing

Understand the concept of Linear Regression, Explain Logistic Regression, Implement WOE, Differentiate between heteroscedasticity and homoscedasticity, Learn the idea of residual analysis

Logistic and Regression Techniques,
Problem of Collinearity,
WOE and IV,
Residual Analysis,
Heteroscedasticity,
Homoscedasticity

learn important keywords in R like Business Intelligence, Business Analytics, Data, and Information, how R can play an essential role in solving complex analytical problems, use 'R' in the industry, compare R with other analytics software, and install R its packages.

Introduction to terms like Business Intelligence,
Business Analytics,
Data, Information,
how information hierarchy can be improved/introduced,
understanding Business Analytics and R,
knowledge about the R language,
its community and ecosystem,
comprehend the use of 'R' in the industry, compare R with other software in analytics
Install R and the packages usable for the course, perform necessary functions in R
using the command line, knowing the usage of IDE R Studio and Various GUI,
use the 'R help' feature in R,
knowledge about the worldwide R community collaboration.

Learn the basics of R programming, like data types and functions. This module presents a scenario and lets you think about the options to resolve it, such as which datatype should store the variable or which R function can help you in this scenario.

The different kinds of data types in R and its appropriate uses.
the built-in functions in R like: seq(), cbind (), rbind(), merge(),
Knowledge on the various subsetting methods,
summarize data by using functions like: str(), class(), length(), nrow(), ncol(),
use of functions like head(), tail(),
for inspecting data,
Indulge in a class activity to summarize data,
dplyr package to perform SQL join in R

learn dirty data set and perform Data Cleaning on it, resulting in a data set ready for any analysis. Thus utilizing and exploring the popular functions needed to clean data in R.

The various steps involved in Data Cleaning,
functions used in Data Inspection,
tackling the problems faced during Data Cleaning,
uses of the functions like grep(), grep(), sub(),
Coerce the data and utilizes the apply() functions.

comprehend the versatility and robustness of R, which can take up data in different formats, from a csv file to the data scratched. This module teaches you different data importing techniques in R.

Import data from spreadsheets and text files into R,
port data from further statistical forms like sas7bdat and spss,
packages installation used for database import,
connect to RDBMS from R utilizing ODBC and necessary SQL questions in R,
basics of Web Scraping.

learn that exploratory data analysis is an essential step in analyzing various tasks involved in a typical EDA process.

Understanding the Exploratory Data Analysis(EDA),
implementation of EDA on various datasets,
Boxplots,
whiskers of Boxplots.
understanding the cor() in R,
EDA functions like summarize(), list(),
multiple packages in R for data analysis,
the Fancy plots like the Component plot, HC plot in R.

learn that Visualization is the USP of R. You will learn the concepts of creating complex and straightforward visualizations in R.

Understanding of Data Visualization,
graphical functions present in R,
plot various graphs like table plots,
histogram,
Boxplot,
customizing Graphical Parameters to improvise actions,
understanding GUIs like Deducer and R Commander,
introduction to Spatial Analysis.

comprehend the various Machine Learning algorithms. The two Machine Learning types are Supervised Learning and Unsupervised Learning, and the distinction between the two types, discuss the process involved in 'K-means Clustering' and the various statistical measures you require to know to execute it in this module.

Introduction to Data Mining,
Understanding Machine Learning,
Supervised and Unsupervised Machine Learning Algorithms,
K-means Clustering.

know how to see the associations between many variables utilizing the popular data mining technique called the "Association Rule Mining" and execute it to predict buyers' next purchase. Learn a new design that can be utilized for recommendation purposes called "Collaborative Filtering." Different real-time-based scenarios are shown utilizing these techniques.

Association Rule Mining,
User-Based Collaborative Filtering (UBCF),
Item Based Collaborative Filtering (IBCF)

Learn the base of 'Regression Techniques.' Linear and logistic RegressionRegression is explained from the basics with the examples, and it is implemented in R using two case studies dedicated to each type of RegressionRegression discussed.

Linear Regression,
Logistic Regression.

Learn about the Analysis of Variance (Anova) Technique. The algorithm and various aspects of Anova have been discussed in this module, Sentiment Analysis, and how we can fetch, extract, and mine live data from Twitter to find out the sentiment of the tweets.

Anova,
Sentiment Analysis.

Learn concepts of Decision Trees and Random Forest. Random Forests algorithm is discussed step-wise and explained with real-life examples. These concepts are implemented on a real-life data set at the end of the class.

Decision Tree,
the three features for classification of a Decision Tree,
Entropy,
Gini Index,
Pruning and Information Gain,
bagging of Regression and Classification Trees,
concepts of Random Forest,
working of Random Forest,
features of Random Forest,
among others.

discusses different concepts taught throughout the course and their execution in a project.

Analyze census data to expect insights on the income of the people,
based on the factors like age, education, work class, occupation
using Decision Trees,
Logistic Regression and Random Forest.
Analyze the Sentiment of Twitter data,
The data to be examined is streamed live from Twitter, and sentiment analysis is conducted.

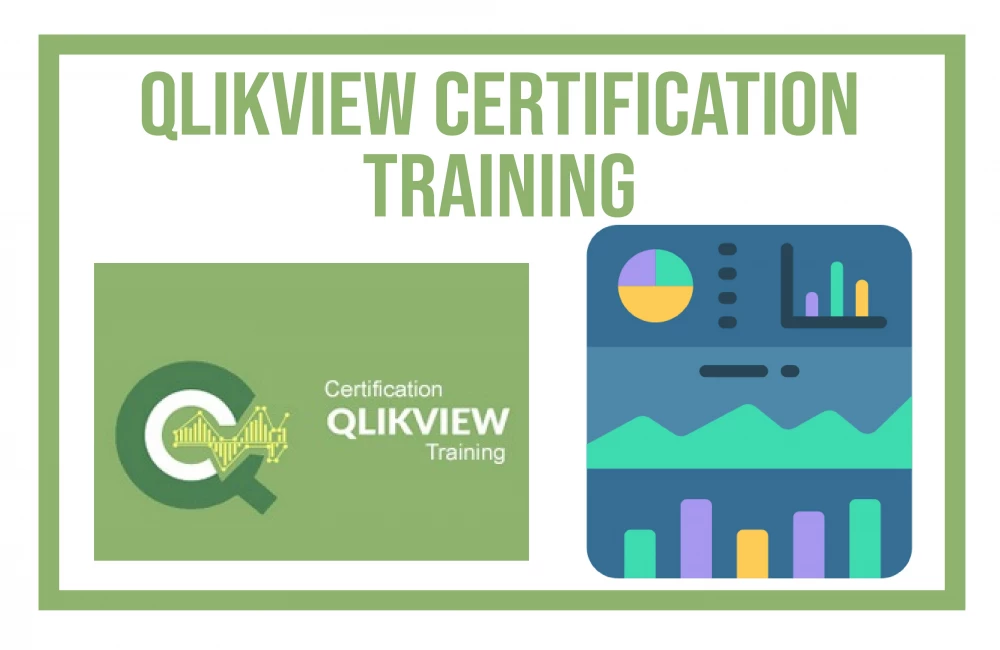
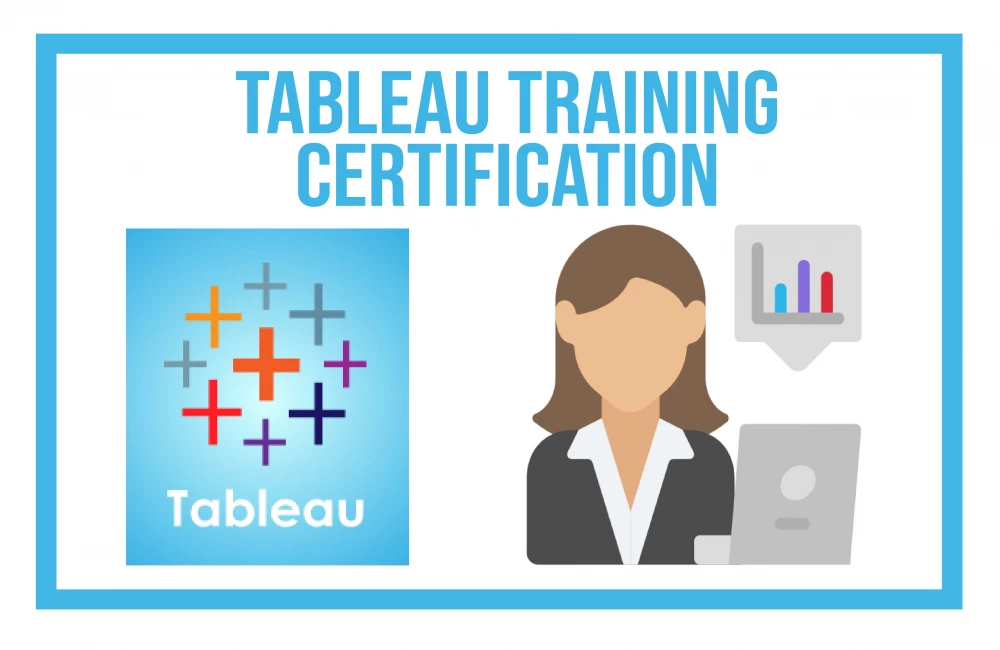
Get a brief idea of the Data Visualization and Tableau Prep Builder tool.

Data Visualization,
Business Intelligence tools,
Introduction to Tableau,
Tableau Architecture,
Tableau Server Architecture,
VizQL,
Introduction to Tableau Prep,
Tableau Prep Builder User Interface,
Data Preparation techniques utilizing the Tableau Prep Builder tool,
Create a simple data flow utilizing the Tableau Prep Builder tool,
Group and Replace feature utilizing Tableau Prep Builder tool,
Pivoting data using the Tableau Prep Builder tool,
Aggregate data utilizing the Tableau Prep Builder tool,
Perform Unions and Joins utilizing the Tableau Prep Builder tool

get a brief idea of Tableau UI components and various ways to establish a data connection.

Features of Tableau Desktop,
Connect to data from File and Database,
Types of Connections,
Joins and Unions,
Data Blending,
Tableau Desktop User Interface,
Basic project (Make a workbook and publish it on Tableau Online),
Joins using Tableau Desktop,
Data Blending feature within Tableau,
Create a Workbook and post it over Tableau Online,
Save a workbook in different formats

comprehend the significance of Visual Analytics and analyze the diverse charts, features, and techniques used for Visualization.

Visual Analytics,
Basic Charts (Bar Chart, Line Chart, and Pie Chart),
Hierarchies,
Data Granularity,
Highlighting,
Sorting,
Filtering,
Grouping,
Sets,
Basic Charts in Tableau,
Illustrate Hierarchies, Data Granularity, and Highlight parts in Tableau,
Complete Sorting, Filtering, and Grouping techniques in Tableau,
Sets in Tableau

understand basic calculations such as Numeric, String Manipulation, Date Function, Logical and Aggregate, Table Calculations, and Level Of Detail (LOD) expressions.

Types of Calculations,
Built-in Operations (Number, String, Date, Logical, and Aggregate),
Operators and Syntax Conventions,
Table Calculations,
Level Of Detail (LOD) Calculations,
Using R within Tableau for Calculations,
Demonstrate calculations using Built-in Functions in Tableau,
Execute Quick Table and Level Of Detail (LOD) calculations in Tableau,
Installing R and designating a connection with R within Tableau

deep dive into Visual Analytics in a more fine manner. It covers different advanced methods for analyzing data, including Forecasting, Trend Lines, Reference Lines, Clustering, and Parameterized concepts.

Parameters,
Tooltips,
Trend lines,
Reference lines,
Forecasting,
Clustering,
Demonstrate Parameters in Calculations,
Perform Data Visualization utilizing Trend lines, Forecasting, and Clustering feature in Tableau,
Project 1- Domain: Media & Entertainment Industry

deep dive into advanced analytical scenarios, utilizing Level Of Detail expressions.

Case 1 - Count Customers by Order
Case 2- Profit per Business Day
Case 3- Comparative Sales
Case 4- Profit Vs. Target
Case 5- Finding the second order date
Case 6- Cohort Analysis
All the use cases are Hands-on intensive

understanding of Geographic Visualizations in Tableau.

Introduction to Geographic Visualizations
Manually assigning Geographical Locations
Types of Maps
Spatial Files
Custom Geocoding
Polygon Maps
Web Map Services
Background Images
Make a Map and assign Geographic locations to the fields
Explain how to make a Map from a Spatial file
Discover how to make a Filled Map, Symbol Map, and a Density Map
Perform Custom Geocoding in Maps
Build a Polygon Map
Establish a connection with the WMS Server
Identify the bottlenecks
Different configurations needed to resolve the bottlenecks
Know tips and tricks to efficient code mappings
Cache and DTM buffer memory configuration

learn to plot various advanced graphs in Tableau Desktop.

Box and Whisker's Plot,
Bullet Chart,
Bar in Bar Chart,
Gantt Chart,
Waterfall Chart,
Pareto Chart,
Control Chart,
Funnel Chart,
Bump Chart,
Step and Jump Lines,
Word Cloud,
Doughnut Chart,
All the above charts have Hands-on

know to create Dashboards and Stories within Tableau.

Introduction to Dashboards,
The Dashboard Interface,
Dashboard Objects,
Building a Dashboard,
Dashboard Layouts and Formatting,
Interactive Dashboards with actions,
Designing Dashboards for devices,
Story Points,
Illustrate how to add things to a Dashboard,
Create a simple Dashboard (using Layouts and Formatting features),
Create Interactive Dashboards using actions,
Remember to make a Dashboard for devices utilizing Device Designer,
Build Stories with Dashboards,
In-class Project 2- Domain: Retail Industry

discover effective ways of creating Dashboards with minimum time investment.

Tableau Tips and Tricks,
Choosing the correct type of Chart,
Format Style,
Data Visualization best practices,
Prepare for Tableau Interview,
Hands-on knowledge of different tips and tricks with Tableau,
In-class Industry Grade Major Project-Domain: Transportation Industry

know to publish data, interact, modify, and secure the issued Data on Tableau Online.

Publishing Workbooks to Tableau Online
Interacting with Content on Tableau Online
Data Management through Tableau Catalog
AI-Powered elements in Tableau Online (Ask Data and Explain Data)
Understand Scheduling
Managing Permissions on Tableau Online
Data Security with Filters in Tableau Online
Publishing Workbooks to Tableau Online
Interacting with Content on Tableau Online
Governing permissions on Tableau Online
Data security using User-based and Row-level filters

know to produce Tableau reports for different industrial scenarios and publish them on Tableau Online. Understand to manage permissions and secure data utilizing filters.

You are recruited as a freelancer for a Retail mart that supplies Furniture, Office Supplies, and Technology products to customers across Europe. You are asked to build interactive dashboards that can achieve insights into the profits for orders over the years.

Learn building blocks and the various fundamental concepts of Power BI.

Business Intelligence,
Self Service Business Intelligence,
SSBI Tools,
Power BI vs. Tableau vs. QlikView,
What is Power BI,
Why Power BI?
Critical Benefits of Power BI,
The flow of Power BI,
Components of Power BI,
The architecture of Power BI,
Building Blocks of Power BI

know how to extract data from various sources, establish connections with Power BI Desktop, perform transformation operations on data, and the Role of Query Editor in Power BI.

Overview of Power BI Desktop,
Data Sources in Power BI Desktop,
Connecting to a data Sources,
Query Editor in Power BI,
Query Ribbon,
Clean and Change data with Query Editor,
Combining Data – Merging and Appending,
Cleaning irregularly formatted data,
Views in Power BI Desktop,
Modelling Data,
Manage Data Relationship,
Automatic Relationship Updates,
Template Apps,
Cross Filter Direction,
Create calculated tables and measures,
Optimizing Data Models ,
BIDS Files

learn the basics of DAX in Power BI Desktop.

Essential concepts in DAX,
Why is DAX important?
DAX Syntax,
Data Types in DAX,
Ranking and rank over groups,
Filter and evaluation context,
Context interactions,
Calculation Types,
DAX Functions ,
Measures in DAX,
DAX Operators,
DAX tables and filtering,
DAX queries,
Create simple and compound measures,
Schema relations,
Star schema design,
DAX Parameter Naming

comprehend the advantages and best practices of Data Visualization. It will also assist you in making charts utilizing Custom Visuals.

Introduction to visuals in Power BI,
Charts in Power BI ,
Matrixes and tables,
Slicers,
Map Visualizations,
Gauges and Single Number Cards ,
Create scatter, waterfall, and funnel charts,
Modifying colors in charts and visuals,
Shapes, text boxes, and images,
What Are Custom Visuals?
Page layout and formatting,
KPI Visuals,
Z-Order,
Explore time-ased data,
AppSource

Learn to create Dashboards and publish them on Power BI services. Know how to monitor Real-time Data with REST API.

Introduction to Power BI Service,
Introduction to using workspaces,
Dashboard vs. Reports,
Quick Insights in Power BI,
Creating Dashboards,
Configuring a Dashboard,
Power BI Q&A,
Ask queries about your data with natural language,
Power BI embedded,
Create custom Q&A suggestions,
Edit tile details and add widgets,
Build apps,
Integrate OneDrive for Business with Power BI

learn how to connect data sources directly to Azure, HD Spark, and My SQL and create interactive dashboards.

Intro to utilizing Excel data in Power BI
Exploring live connections to Data with Power BI
Linking directly to SQL Azure, HD Spark, SQL Server Analysis Services/ My SQL
Introduction to Power BI Development API
Import Power View and Power Pivot to Power BI
Power BI Publisher for Excel
Content packs
Data caching and refresh
Introducing Power BI Mobile

comprehend Power BI Report Servers and data gateways. Learn about the web portal where you display and manage reports and KPIs.

Report Server Basics,
Web Portal,
Paginated Reports,
Row-level Security,
Data Gateways,
Scheduled Refresh,
Configure scheduled refresh,
Create a publish-to-web embed code,
Customize the sample Power BI file

learn to create R and Python visuals in Power BI Desktop and Power BI Service.

R Integration in Power BI Desktop,
R visuals in Power BI,
R Powered Custom Visuals,
Creating R visuals in Power BI,
R Visuals in Power BI Service,
R Scripts Security,
Creating visuals using Python

create a specific project where you will include all your learnings of Power BI. At the end of this Power BI online training module, learn to integrate various features as per the requirements of your Enterprise

The complete project covers all essentials of the course.

learn about the different Object Storage Services offered by AWS, identify when to use a specific service, store/transfer data using these services, and optimize the storage cost.

Traditional Storage,
Need to Move to Cloud Storage,
Traditional vs. Cloud Storage Cost,
Cloud Storage,
Different Storage Options Available on AWS,
Simple Storage Service (S3) and Its Components,
Working of S3,
Difference Between S3, EBS, and EFS,
Bucket Policy,
Access Control List(ACL),
Versioning,
Cross-Region Replication (CRR) and Its Use Case,
Amazon S3 Transfer Acceleration,
Choice of Storage Classes on S3,
Lifecycle Policy of S3 Bucket,
CDN: CloudFront and AWS Global Accelerator,
Storage Gateways,
Hosting a Static Website on Amazon S3 ,
Versioning in AWS S3,
Replicating data across regions,
Transmit and recover data from Glacier through lifecycle policy,
Direct Data Migration to Amazon S3 Glacier Vault via AWS CLI,
Accessing a static website through CloudFront,
File Share via AWS Storage Gateway

FAQ

The average salary for a data analyst is $67,150 per year

Data analytics is significant for top organizations. Job opportunities are on the rise. Increasing salaries for data analytics professionals. Work opportunities in a spectrum of industries. You will influence the decision-making in the company.

Data analysts are also not needed to have advanced coding skills. Instead, they should have experience utilizing analytics software, data visualization software, and data management programs. As with most data careers, data analysts must have high-quality mathematics skills.

To better understand the Data Analytics Masters Program Certification Training, one must learn as per the curriculum.

Data analysts depend on skills like programming in R or Python, querying databases with SQL, and performing statistical analysis. While these skills can be challenging, it's possible to learn them (and land a data analyst job) with the right mentality and plan of action.

Big data analytics enables communities to harness their data and utilize it to recognize new opportunities. That, in turn, guides to more creative business moves, more efficient operations, increased profits, and happier customers. Businesses that use big data with advanced analytics gain value in many ways, such as reducing costs.

SQL, or Structured Query Language, is the ubiquitous industry-standard database language and is possibly the most critical skill for data analysts to know. The language is often thought of as the "graduated" version of Excel; it can handle large datasets that Excel simply can't.

product-2.jpg
$2476 $2606
$130 Off
ADD TO CART

Training Course Features

Assessments
Assessments

Every certification training session is followed by a quiz to assess your course learning.

Mock Tests
Mock Tests

The Mock Tests Are Arranged To Help You Prepare For The Certification Examination.

Lifetime Access
Lifetime Access

A lifetime access to LMS is provided where presentations, quizzes, installation guides & class recordings are available.

24x7 Expert Support
24x7 Expert Support

A 24x7 online support team is available to resolve all your technical queries, through a ticket-based tracking system.

Forum
Forum

For our learners, we have a community forum that further facilitates learning through peer interaction and knowledge sharing.

Certification
Certification

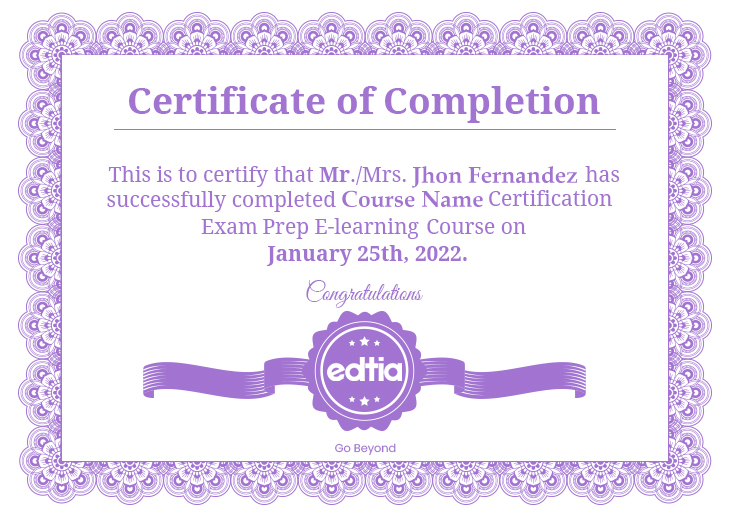
Successfully complete your final course project and Edtia will provide you with a completion certification.

Data Analytics Masters Program

A Data Analytics Masters Program Training is a certification that demonstrates that the holder has the proficiency and aptitudes needed to work with Data Analytics.

By enrolling in the Data Analytics Masters Program Training and completing the module, you can get the Edtia Data Analytics Masters Program Certification.

The recommended duration to complete this Data Analyst Certification program is 15 weeks. However, it is up to the individual to complete this online Data Analyst Course at their own pace.

Yes, We will be providing you with a certificate of completion for every course part of the learning pathway once you have successfully submitted the final assessment and our subject matter experts have verified it.

demo certificate

Reviews

A Alvis
J John
S Shira
J Jacob
J Jacob
S Shira
J John
A alvis
J Joshep
O Okba
E Erin
L Lymm
K Kristina
C Charious

Related Courses

Discover your perfect program in our courses.

Contact Us

Drop us a Query

Drop us a Query

Available 24x7 for your queries